[1] "Debug: most_positive_word after assignment"
[1] confidence
attr(,"scores")
achievement anxiety anxious better confidence confident
7 45 8 8 44 12
darker deviation difficult favour good issues
9 8 5 8 7 5
lack like outperform problem problems pure
39 12 20 21 22 26
significant top well worry
22 7 17 5
22 Levels: difficult issues worry achievement good top anxious ... anxiety
[1] "Debug: most_negative_word after assignment"
[1] anxiety
attr(,"scores")
achievement anxiety anxious better confidence confident
7 45 8 8 44 12
darker deviation difficult favour good issues
9 8 5 8 7 5
lack like outperform problem problems pure
39 12 20 21 22 26
significant top well worry
22 7 17 5
22 Levels: difficult issues worry achievement good top anxious ... anxiety
[1] "Debug: most_positive_word"
[1] "confidence"
[1] "Debug: most_negative_word"
[1] "anxiety"
[1] "Debug: colnames(word_ratios)"
[1] "word2" "self" "behaviour" "mathematics" "confidence"
[6] "of" "math" "greater" "2011" "and"
[11] "anxiety" "between" "in" "is" "test"
[16] "their" "worries"
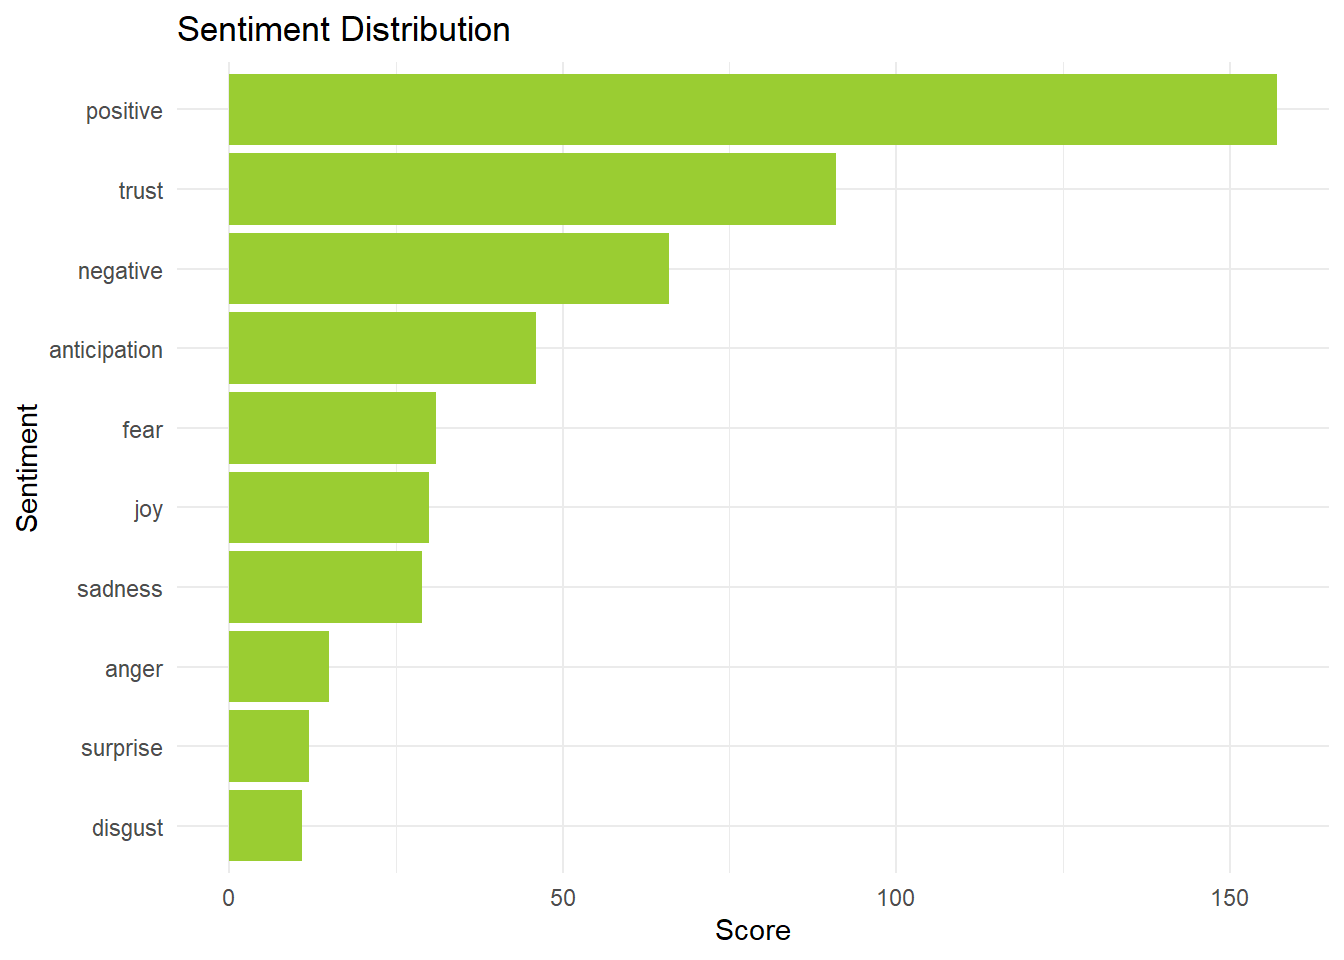
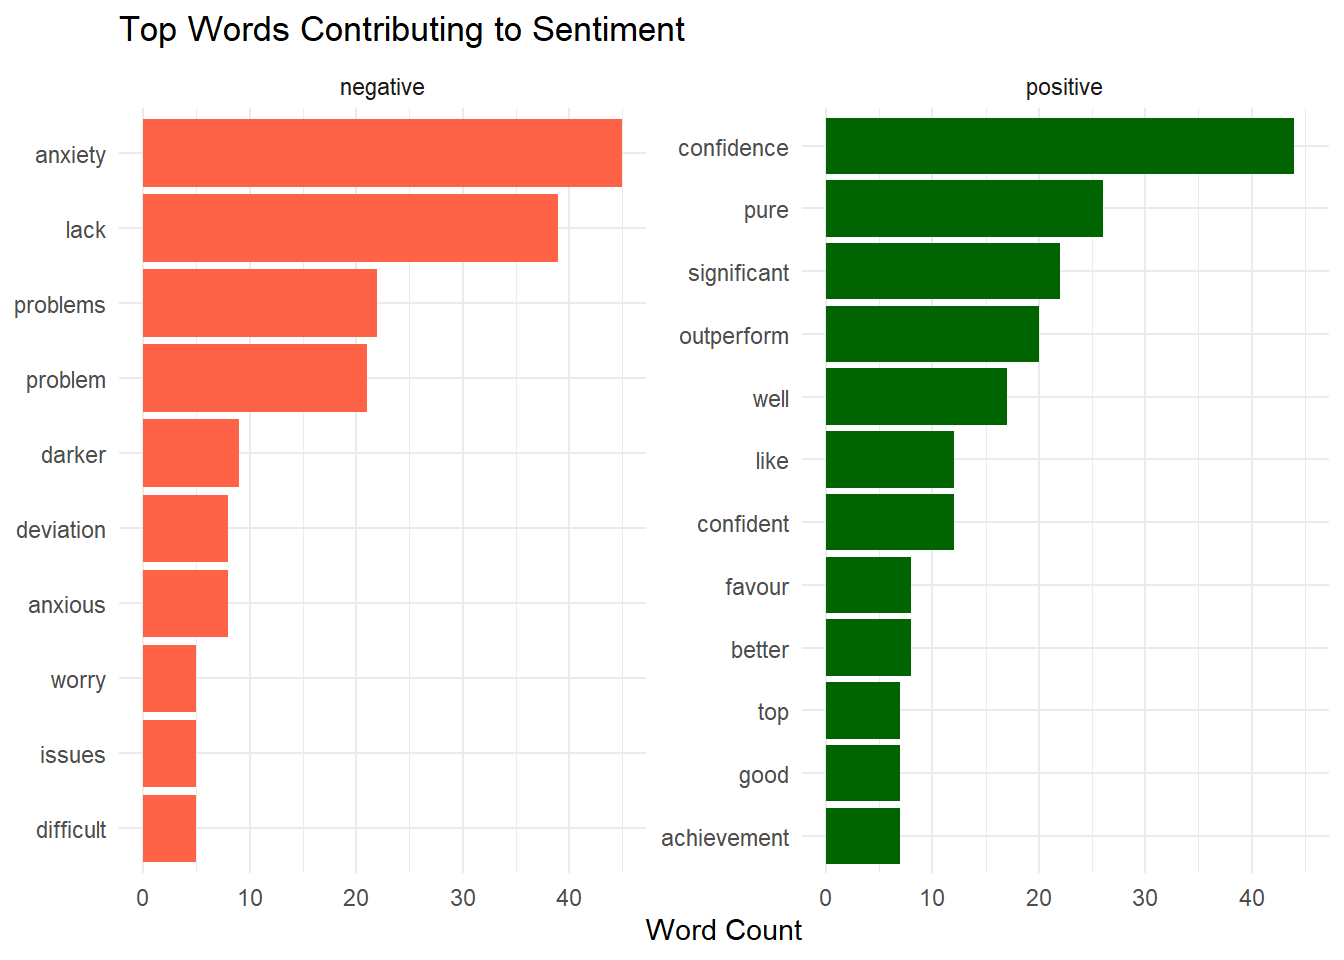
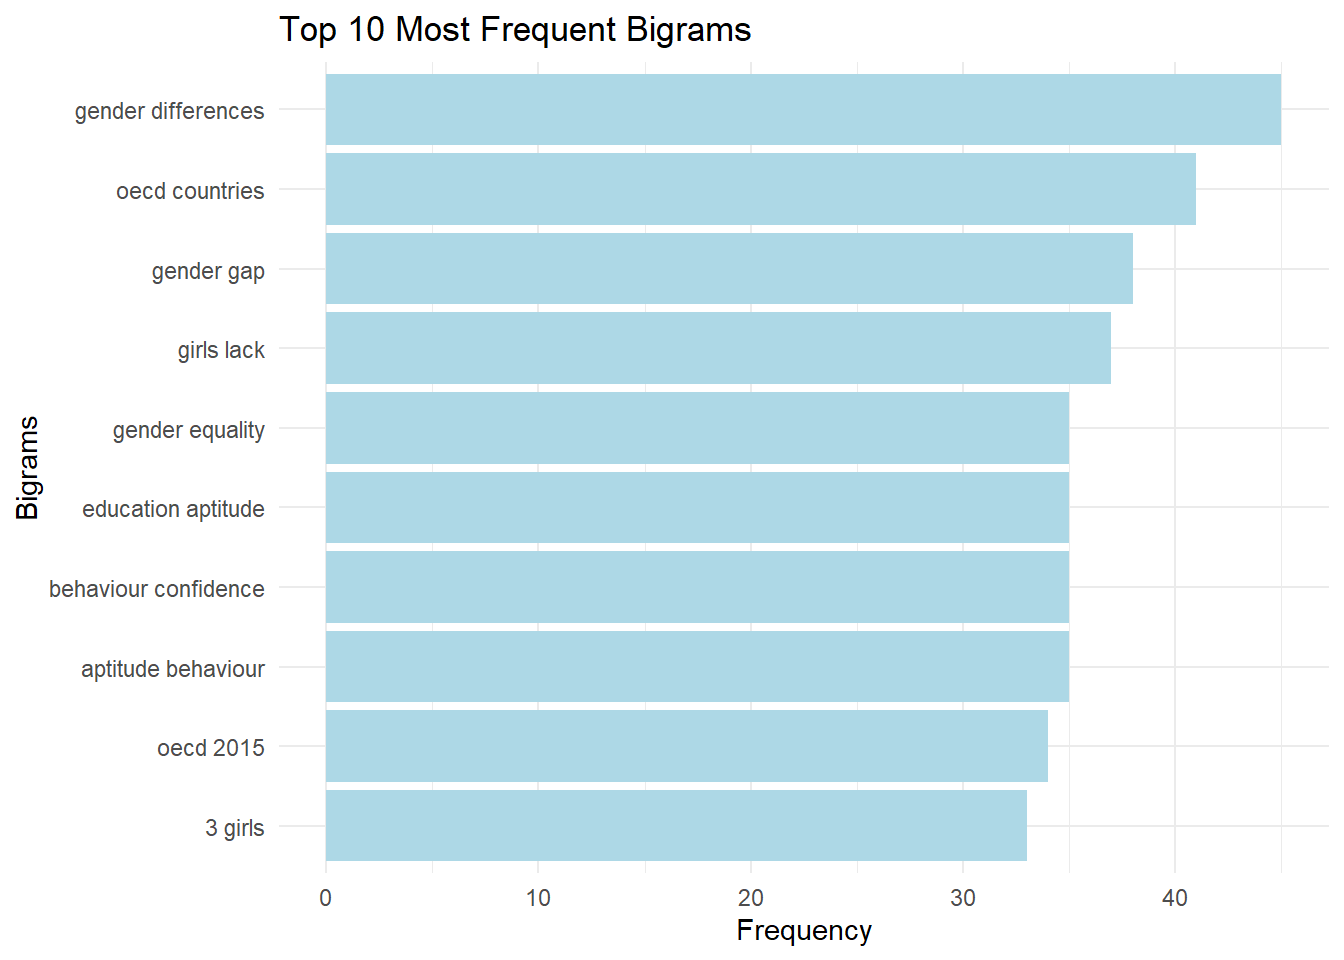
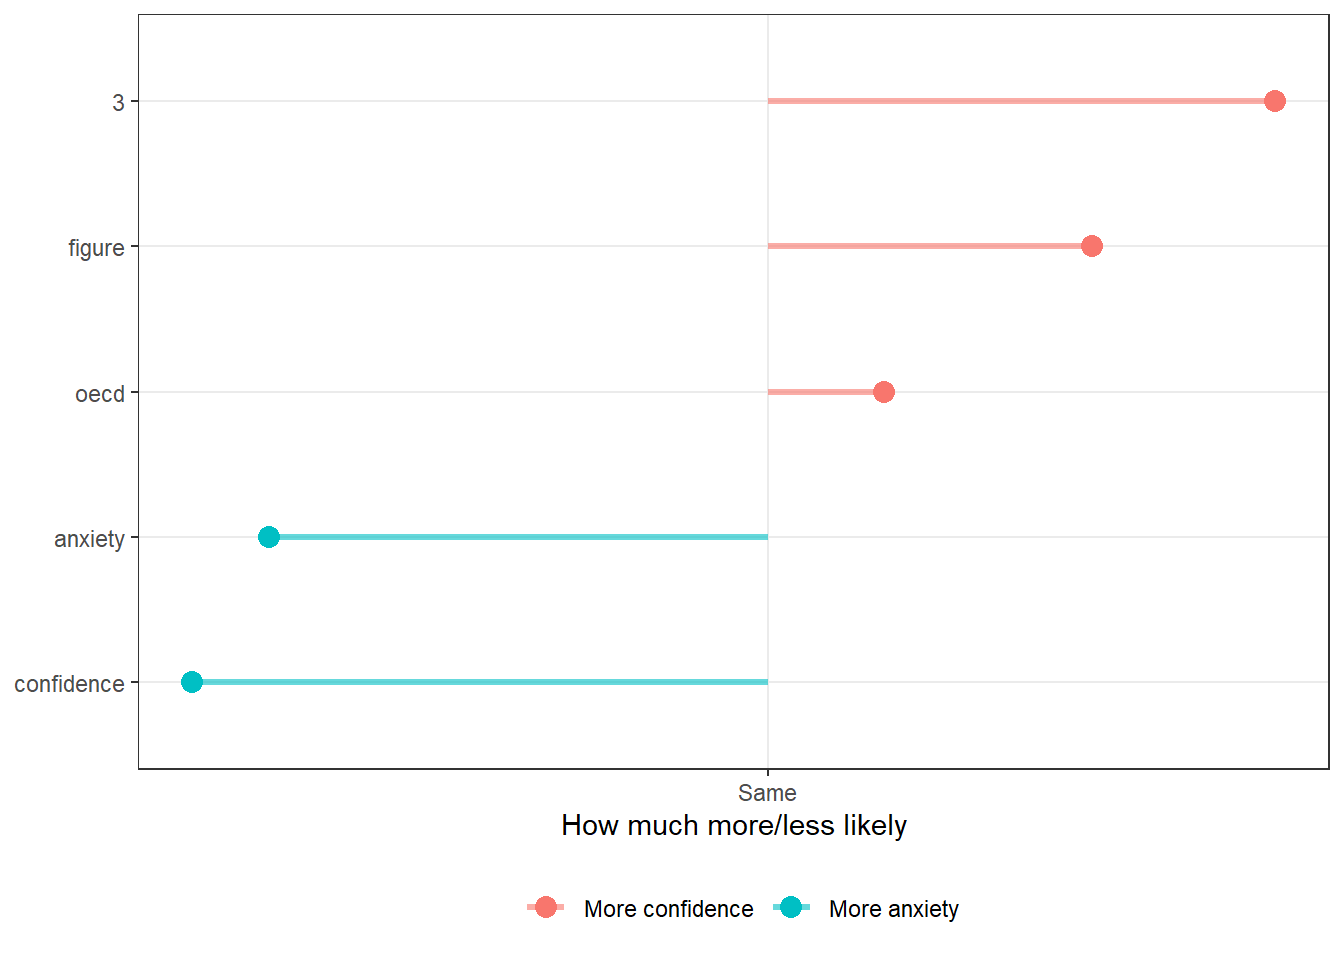
El documento 'ch3.pdf' contiene 7554 palabras y se centra principalmente en mathematics, girls, boys, oecd, gender, science, differences, countries, students, performance. El texto exhibe un tono predominantemente positive. Los temas más importantes que surgen del análisis incluyen gender differences, oecd countries, gender gap, girls lack, aptitude behaviour. Las palabras que más contribuyen al sentimiento positivo son confidence, pure, significant, outperform, well, mientras que las que más contribuyen al sentimiento negativo son anxiety, lack, problems, problem, darker. Las principales oraciones del documento son: 78 © OECD 2015 The ABC of Gender Equality in Education: Aptitude, Behaviour, Confidence
3
Girls’ Lack of Self-Confidence
• Figure 3.11 •
Role of science self-beliefs in reducing the gender gap
among the highest‑achieving students
Gender gap before accounting for gender differences
in science self-beliefs
Gender gap after accounting for gender differences
in science self-beliefs
Liechtenstein Liechtenstein
Argentina Argentina
Norway Norway
Iceland Iceland
Sweden Sweden
Qatar Qatar
Jordan Jordan
Slovenia Slovenia
Switzerland Switzerland
Lithuania Lithuania
United States United States
France France
Finland Finland
New Zealand New Zealand
Korea Korea
Netherlands Netherlands
Australia Australia
Canada Canada
Denmark Denmark
Belgium Belgium
Azerbaijan Azerbaijan
Turkey Turkey
Latvia Latvia
Tunisia Tunisia
Thailand Thailand
Bulgaria Bulgaria
United Kingdom United Kingdom
OECD average OECD average
Czech Republic Czech Republic
Greece Greece
Austria Austria
Chinese Taipei Chinese Taipei
Serbia Serbia
Ireland Ireland
Estonia Estonia
Macao-China Macao-China
Hong Kong-China Hong Kong-China
Japan Japan
Germany Germany
Italy Italy
Spain Spain
Kyrgyzstan Kyrgyzstan
Romania Romania
Montenegro Montenegro
Croatia Croatia
Slovak Republic Slovak Republic
Poland Poland
Luxembourg Luxembourg
Uruguay Uruguay
Mexico Mexico
Russian Federation Russian Federation
Hungary Hungary
Portugal Portugal
Israel Israel
Brazil Brazil
Colombia Colombia
Chile Chile
Indonesia Indonesia
-40 -30 -20 -10 0 10 20 30 Score-point differences (B – G)
Note: Score-point differences between boys and girls that are statistically significant are marked in a darker tone. | The ABC of Gender Equality in Education: Aptitude, Behaviour, Confidence © OECD 2015 79
3
Girls’ Lack of Self-Confidence
• Figure 3.12 •
Role of mathematics self-beliefs in reducing the gender gap
among the highest-achieving students
Gender gap before accounting for gender differences
in mathematics self-beliefs
Gender gap after accounting for gender differences
in mathematics self-beliefs
Finland Finland
Sweden Sweden
United Kingdom United Kingdom
Thailand Thailand
Macao-China Macao-China
Russian Federation Russian Federation
Belgium Belgium
Lithuania Lithuania
New Zealand New Zealand
Australia Australia
Iceland Iceland
Norway Norway
Switzerland Switzerland
Germany Germany
Shanghai-China Shanghai-China
Denmark Denmark
Chinese Taipei Chinese Taipei
Slovenia Slovenia
Czech Republic Czech Republic
Latvia Latvia
Kazakhstan Kazakhstan
Albania Albania
Estonia Estonia
France France
Peru Peru
OECD average OECD average
Viet Nam Viet Nam
Qatar Qatar
Canada Canada
Hungary Hungary
Croatia Croatia
Singapore Singapore
Montenegro Montenegro
Luxembourg Luxembourg
Greece Greece
Jordan Jordan
Ireland Ireland
Romania Romania
United States United States
Serbia Serbia
Turkey Turkey
Netherlands Netherlands
Poland Poland
Hong Kong-China Hong Kong-China
Malaysia Malaysia
Indonesia Indonesia
Mexico Mexico
Bulgaria Bulgaria
Tunisia Tunisia
Portugal Portugal
Spain Spain
United Arab Emirates United Arab Emirates
Argentina Argentina
Slovak Republic Slovak Republic
Austria Austria
Chile Chile
Brazil Brazil
Uruguay Uruguay
Italy Italy
Costa Rica Costa Rica
Korea Korea
Japan Japan
Liechtenstein Liechtenstein
Israel Israel
Colombia Colombia
-20 -10 0 10 20 30 40 50 Score-point differences (B – G)
Note: Score-point differences between boys and girls that are statistically significant are marked in a darker tone. | 64 © OECD 2015 The ABC of Gender Equality in Education: Aptitude, Behaviour, Confidence
3
Girls’ Lack of Self-Confidence
• Figure 3.1 •
Girls’ and boys’ average performance in mathematics in the ten countries
with the highest average performance among girls
Boys Girls
Shanghai-China
Singapore
Hong Kong-China
Chinese Taipei
Korea
Liechtenstein
Japan
Macao-China
Switzerland
Netherlands
Estonia
Canada
Germany
Belgium
Poland
Finland
Austria
Viet Nam
Australia
Ireland
New Zealand
Denmark
Czech Republic
Slovenia
Luxembourg
United Kingdom
OECD average
France
Italy
Portugal
Spain
Norway
Iceland
Latvia
Slovak Republic
United States
Hungary
Russian Federation
Lithuania
Sweden
Croatia
Israel
Greece
Serbia
Turkey
Romania
Bulgaria
Chile
Kazakhstan
United Arab Emirates
Mexico
Costa Rica
Thailand
Malaysia
Uruguay
Montenegro
Brazil
Tunisia
Argentina
Albania
Colombia
Peru
Indonesia
Jordan
Qatar
350 400 450 500 550 600 650 Mean score
Countries and economies are ranked in descending order of the mean score in mathematics among boys. | The ABC of Gender Equality in Education: Aptitude, Behaviour, Confidence © OECD 2015 85
3
Girls’ Lack of Self-Confidence
• Figure 3.17 •
Role of grade repetition and study programme in explaining
gender differences in students’ experience with pure mathematics tasks
Gender gap
Gender gap after accounting for grade and study programme
Serbia Serbia
Montenegro Montenegro
Thailand Thailand
Bulgaria Bulgaria
Lithuania Lithuania
Latvia Latvia
Greece Greece
Turkey Turkey
Hungary Hungary
Malaysia Malaysia
Slovenia Slovenia
Croatia Croatia
Estonia Estonia
Israel Israel
Finland Finland
Liechtenstein Liechtenstein
Russian Federation Russian Federation
Poland Poland
Jordan Jordan
Indonesia Indonesia
Uruguay Uruguay
Romania Romania
Slovak Republic Slovak Republic
Tunisia Tunisia
Czech Republic Czech Republic
Norway Norway
Kazakhstan Kazakhstan
Iceland Iceland
Argentina Argentina
Canada Canada
Viet Nam Viet Nam
OECD average OECD average
Germany Germany
Chinese Taipei Chinese Taipei
Japan Japan
Korea Korea
Switzerland Switzerland
United States United States
United Arab Emirates United Arab Emirates
Italy Italy
Shanghai-China Shanghai-China
Austria Austria
Hong Kong-China Hong Kong-China
Spain Spain
Denmark Boys are less familiar with Denmark
France pure mathematics than girls France
Luxembourg Luxembourg
Macao-China Macao-China
Peru Peru
Sweden Sweden
Chile Chile
Belgium Belgium
Qatar Qatar
Netherlands Netherlands
Mexico Mexico
Ireland Ireland
United Kingdom United Kingdom
Portugal Portugal
Singapore Singapore
Costa Rica Costa Rica
Colombia Colombia
New Zealand New Zealand
Brazil Brazil
Australia Australia
Albania Albania
-0.45 -0.40 -0.35 -0.30 -0.25 -0.20 -0.15 -0.10 -0.05 0.00 0.05 Mean index difference
(B – G)
Note: Gender differences that are statistically significant are marked in a darker tone. | 84 © OECD 2015 The ABC of Gender Equality in Education: Aptitude, Behaviour, Confidence
3
Girls’ Lack of Self-Confidence
• Figure 3.16 •
Role of grade repetition and study programme in explaining
gender differences in students’ familiarity with formal mathematics
Gender gap
Gender gap after accounting for grade and study programme
Jordan Jordan
Turkey Turkey
Latvia Latvia
United Arab Emirates United Arab Emirates
Bulgaria Bulgaria
Lithuania Lithuania
Iceland Iceland
Greece Greece
Thailand Thailand
Hungary Hungary
United States United States
Portugal Portugal
Finland Finland
Slovak Republic Slovak Republic
Estonia Estonia
Spain Spain
Serbia Serbia
Poland Poland
Russian Federation Russian Federation
Singapore Singapore
Viet Nam Viet Nam
Uruguay Uruguay
Canada Canada
Chinese Taipei Chinese Taipei
Sweden Sweden
Argentina Argentina
Croatia Croatia
Israel Israel
Romania Romania
France France
OECD average OECD average
Montenegro Montenegro
Ireland Ireland
Slovenia Slovenia
United Kingdom United Kingdom
Shanghai-China Shanghai-China
Brazil Brazil
Tunisia Tunisia
Czech Republic Czech Republic
Germany Germany
New Zealand New Zealand
Peru Peru
Korea Boys are less familiar Korea
Kazakhstan Kazakhstan
Mexico with formal mathematics Mexico
Australia than girls Australia
Belgium Belgium
Costa Rica Costa Rica
Italy Italy
Netherlands Netherlands
Malaysia Malaysia
Austria Austria
Chile Chile
Indonesia Indonesia
Switzerland Switzerland
Denmark Denmark
Luxembourg Luxembourg
Colombia Colombia
Albania Albania
Macao-China Macao-China
Japan Japan
Qatar Qatar
Hong Kong-China Hong Kong-China
Liechtenstein Liechtenstein
-0.60 -0.50 -0.40 -0.30 -0.20 -0.10 0.00 0.10 0.20 0.30 Mean index difference
(B – G)
Note: Gender differences that are statistically significant are marked in a darker tone.. Un análisis comparativo entre la palabra más positiva ('confidence') y la más negativa ('anxiety') se muestra en el gráfico adjunto.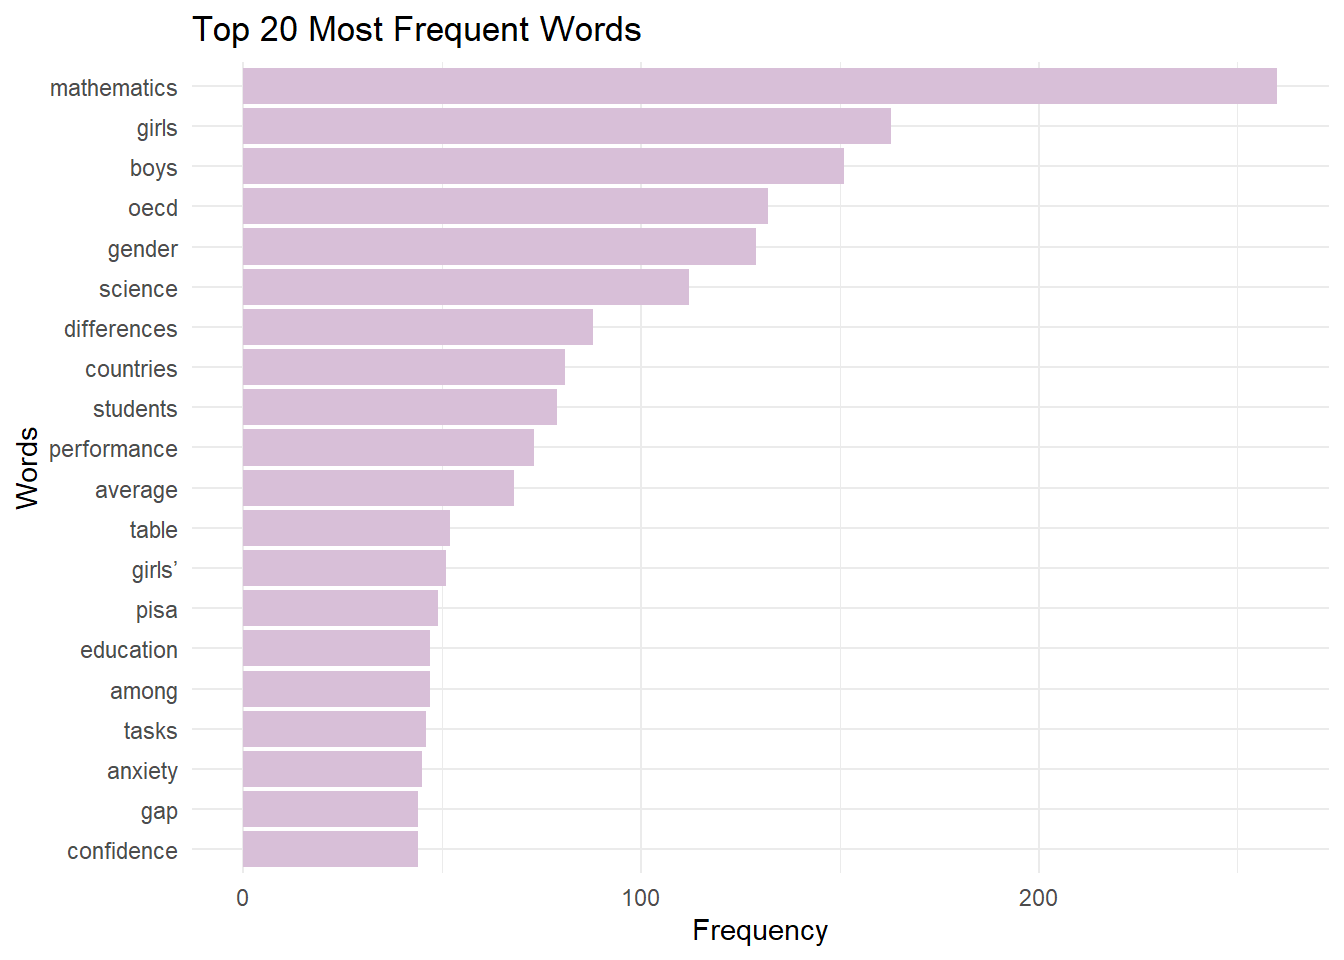
Parsing text into sentences and tokens...DONE
Calculating pairwise sentence similarities...DONE
Applying LexRank...DONE
Formatting Output...DONE


LexRank Summary: